Look up a common word in the OED, and chances are you’ll find it was first recorded in English over 700 years ago. Every word in the previous sentence is at least that old, with an average (mean) age of 1,022 years. So it stands to reason that, all other things being equal, the farther back you go in time, the more newer words you’d expect to find–even accounting for regular language development, there should be a greater number of recently recorded words in 1213 than in 2013.
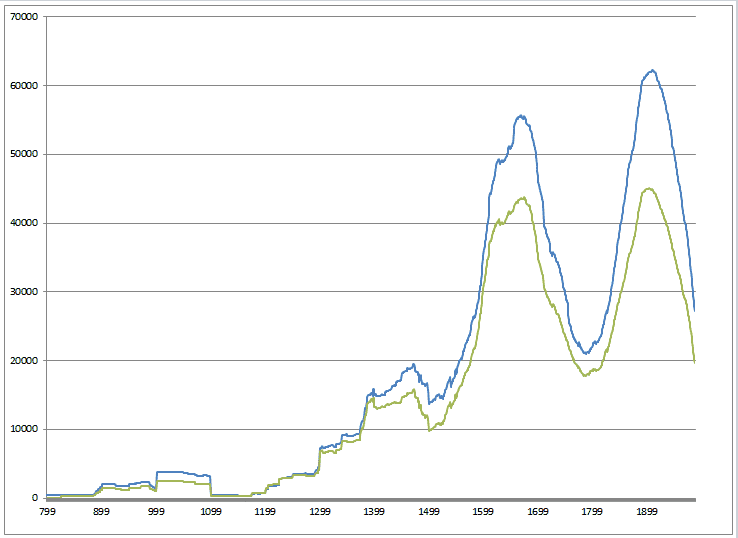
But all other things aren’t equal, and there are a few reasons why first recorded usages don’t decrease with time, or even behave all that predictably. First, let’s look at some counts. The graph below is a rolling average of first recorded usages in OED, by date. First uses of a word are in blue, while first uses of a subsequent sense of a word are in green (no double counting). For any year on the X axis, the Y axis shows the number of new words or senses in the 100 years leading up to it:
Number of words (blue) and new senses (green) coined in prev. 100y
 The first thing to notice is that the two lines look very similar, even though there’s no double counting of quotations.
The next thing is that the graph rises from left to right, instead of falling. That is, the farther back we go in time, the fewer newly recorded words we find, against expectation.
The final thing to notice is the two humps, peaking at 1666 and 1903, with a deep valley in between. In the 100 years leading up to these two peaks, we have 55,433 and 61,650 newly recorded words, respectively. On first blush, it would appear that the periods from Shakespeare to Milton and from Wordsworth to Swinburne contributed an inordinate number of words to the language.
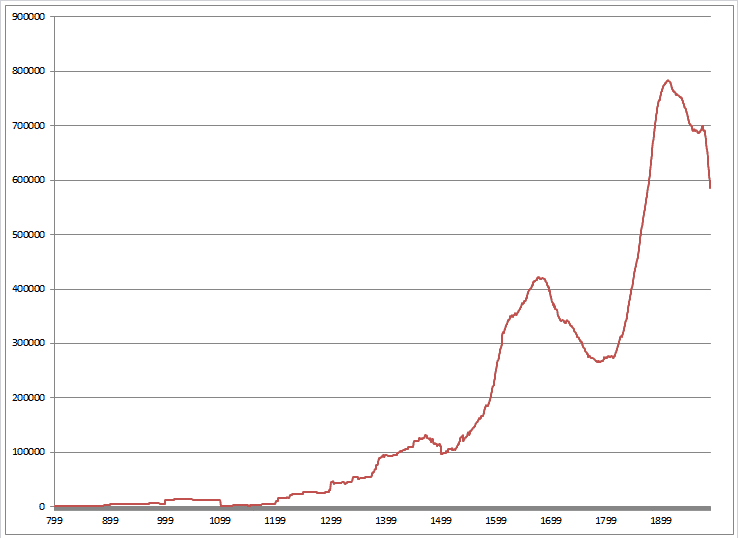
What to make of this, given the initial premise? First, the overall similarity of the the graphs suggests an important factor influencing both lines hasn’t been taken into account. An obvious candidate is the total amount of evidence available to (or used by) the lexicographers who compiled the dictionary. To think about it materially, older books are rarer than newer books [for some reasons why, see here], and fewer sources means less evidence. So here’s a graph showing the rolling number of all evidence quotations in the trailing 100 years:
Number of quotations in previous 100y period
 This graph also has two humps, and also peaks in the late 1660s and early 1900s. A third smaller hump, around 1450, also can be seen in both graphs. (The drop off after about 1910 occurs because almost all evidence after the 1880s was added for the Supplements and second edition, which eventually came out in 1989). This chart also rises from left to right, confirming that the father back in time we go, the fewer total quotations there tend to be.
But the humps also tell us that there are a lot more total 15th, 16th and 19th century quotations than 18th century quotations, and it just isn’t the case that more books have survived from Shakespeare’s day than from Johnson’s. Charlotte Brewer has discussed the under-representation of 18th C texts in OED, a problem recognized even by its first editor, James Murray. Here the cause may have more to do with the reading preferences of those late Victorian readers who volunteered their time to collecting quotations, rather than the actual availability of texts.
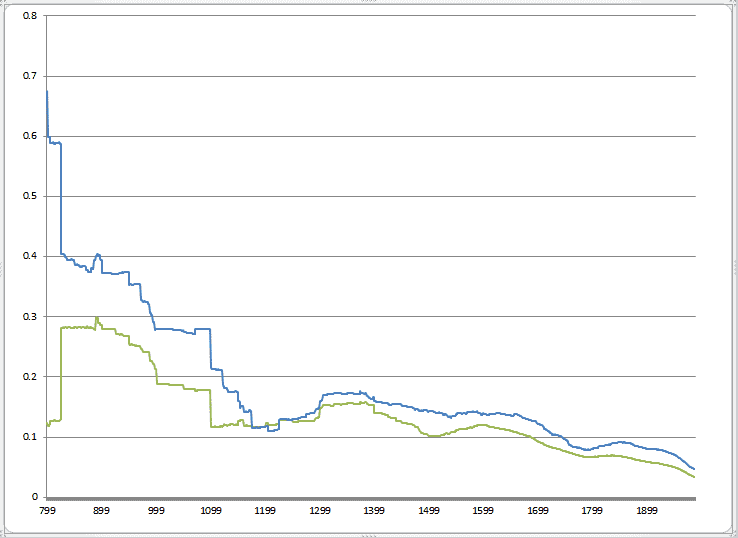
To go back to first word and sense usages, we can see that the middle hump is much more pronounced in the first graph than it is in the overall quotation count. This means that OED lexicographers, with the evidence they had a their disposal, found relatively more new coinages in the 15th-16th centuries than they did in the 19th, which would conform to expectations. We could normalize the entire first graph by the number of available quotations, to get a relative number of first usages per total usages recorded, which would give the following picture:
New words and senses per total quotations, trailing 100y
This, finally, shows the declining rate we would expect if the OED were a perfect, impartial recorder of first uses, and if word and sense coinage occurred in a regular way over time. The two later bumps look much less impressive in this graph, though there does seem to be something happening around 1200. The data before that, swiftly declining, is more sensitive to the appearance of individual works, because the raw numbers are relatively small (this is why we see jagged edges).
Now, this doesn’t debunk the idea that the age of Shakespeare was a great time of word and sense coinage. The raw numbers are what they are–more words are first attested in that period than ever before, and only the period immediately leading up to the publication of OED compares. But it does show that the sample is significantly skewed by the availability of evidence. In order to make actual conclusions about word coinage, we would need more data on the actual rate of textual production in these time periods [and ideally some data on how spoken language filters through to written language over time], though this would only be relevant as far back as the widespread use of the printing press.

Fascinating information–good to know the English Renaissance can still regarded as the “brave new world” of neologisms.